Latest On The Conservation Gateway

A well-managed and operational Conservation Gateway is in our future! Marketing, Conservation, and Science have partnered on a plan to rebuild the Gateway into the organization’s enterprise content management system (AEM), with a planned launch of a minimal viable product in early FY26. If you’re interested in learning more about the project, reach out to megan.sheehan@tnc.org for more info!

Many tools are available to support the practice of conservation.  Below represents a list of the most commonly used tools by Conservancy staff.  We define tools here as Programs or resources that help users develop, manage, analyze, use, and publish conservation information.

Note that some of these resources are only available on the TNC intranet (or VPN), they are marked with "TNC Intranet required." Other resources work outside of TNC offices but require a TNC account to log in, and are marked with "TNC account required."

Information & Web Resources:
These are online resources or web applications to help you find and manage relevant information.
Centre for Evidence-Based Conservation
Climate Wizard
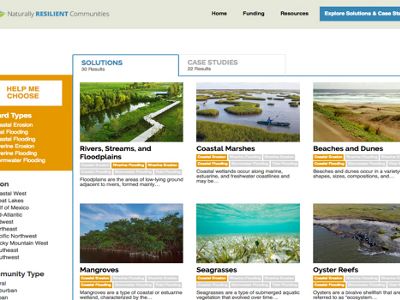
Coastal Resilience
CONNECT
ConservationEvidence.com
Conservation Partnership Center
Conservation Project Database (ConPro)
ConserveOnline
Ecoregional Assessment Status Tool (EAST)
Fire Data Management Tool (FDMT)
GIS Listserv
INFFER
Invasive Plant Management Decision Analysis Tool (IPMDAT)
LANDFIRE Datasets and Tools
Map of Life
Marine Conservation Agreements - A Practitioner's Toolkit
Marine Ecosystem-based Management Toolkit
Metadata Standards for TNC
Protected Areas Resources
Science Chronicles
Scientific Journals
Technology Blueprint
Terra-i
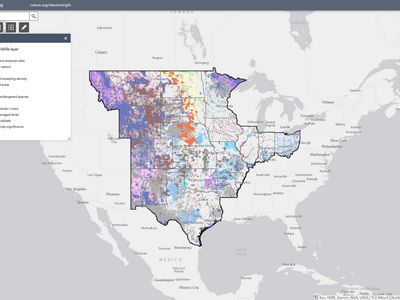
TNC Maps (maps.tnc.org)

Desktop Software:
These programs require installation, and run on your computer (or at least have a desktop user interface.
ArcGIS Desktop
ArcGIS Explorer
Conservation Action Planning (CAP) Workbook
Conservation Land System (CLS)
Data Thief
Gap Light Analyzer (GLA)
Google Earth
Indicators of Hydrologic Alteration (IHA)
Impervious Surface Analysis Tool (ISAT)
MARXAN
Miradi
Protected Areas Tools (PAT) for ArcGIS
SaveDBF (Excel add-in)
Spatial Portfolio Optimization Tool (SPOT)
Statistical Software (SAS and JMP)
Weed Information Management System (WIMS)


ArcGIS Desktop

ESRI's ArcGIS Desktop (10.1) is powerful Geographic Information System (GIS) software which allows you to work with spatial data, and includes ArcMap, ArcCatalog, and ArcToolbox. TNC has free licenses to use this software (as well as extensions such as X Tools and Jenness Tools); TNC staff who would like a copy can contact their local GIS coordinator. Staff interested in publishing their spatial data via web maps should contact core_data@tnc.org.
When should you use it?

  • Make maps or diagrams of spatial data
  • Manage, manipulate, or analyze spatial data
  • Use extensions (e.g. X Tools) to extend the functionality of ArcMap
  • Prepare to publish spatial data via ArcGIS Server

For more information about ArcGIS Desktop:
Public Site:
http://www.esri.com/software/arcgis/arcinfo/index.html.
OR
TNC account required:
https://connect.tnc.org/Departments/TechnologyInformationSystems/GISProgram/Pages/GIS%20%20GIS%20Software%20%20ESRI%20Software%20Home%20Page.aspx.
Questions? Email chughes@tnc.org (Reviewed Dec 2012)


ArcGIS Explorer

ArcGIS Explorer is a free application similar to google earth that provides an easy to use way to view and share spatial information. Similar to google earth, it provides 3D views and aerial photography for you to layer your data with, and it allows you to add kml/kmz files, or a variety of other custom content. Unlike google earth, it doesn't have as much data loaded in by default, but it lets you add in shapefiles and raster data not supported by the free version of google earth.  There is also a lot of additional data and base maps available at the ArcGIS Explorer Resource Center.
When should you use it?

  • Share interactive spatial data with people who do not have ArcGIS Desktop.
  • Create 'flyovers' or animations showing your data in a 3D landscape.
  • Compare data available online as web services with your local shapefiles.

For more information about ArcGIS Explorer:
Public Site:
http://www.esri.com/software/arcgis/explorer/index.html
Questions? Check the ESRI FAQ page for ArcGIS Explorer (Reviewed Jul 2010)


Centre for Evidence-Based Conservation

The Centre for Evidence Based Conservation (CEBC) carries out systematic reviews of the effectiveness of conservation practices across multiple projects. The goal of the site is to support decision making in conservation and environmental management. See also ConservationEvidence.com.
When should you use it?

  • Learn which conservation actions are most effective in achieving desired outcomes, i.e. re-introducing native species, restoring habitat, controlling invasive species, etc.
  • Contribute information based on your own experience carrying out conservation interventions – which ones worked and, just as importantly, which ones didn’t work.

For more information about the Centre for Evidence-Based Conservation:
Public Site:
http://www.cebc.bangor.ac.uk
Questions? Email cebc-info@bangor.ac.uk (Reviewed Feb 2012)


Climate Wizard

Climate Wizard enables technical and non-technical audiences alike to access leading climate change information and visualize the impacts anywhere on Earth.  The first generation of this web-based program allows the user to choose a state or country and both assess how climate has changed over time and to project what future changes are predicted to occur in a given area. Climate Wizard represents the first time ever the full range of climate history and impacts for a landscape have been brought together in a user-friendly format.
When should you use it?

  • View historic temperature and rainfall maps for anywhere in the world.
  • View and download state-of-the-art future predictions of temperature and rainfall around the world.
  • View and download climate change maps for a variety of possible scenarios in a few easy steps.

For more information about Climate Wizard:
Public Site:
http://www.climatewizard.org/
Questions? Email czganjar@tnc.org (Reviewed Feb 2012)


Coastal Resilience

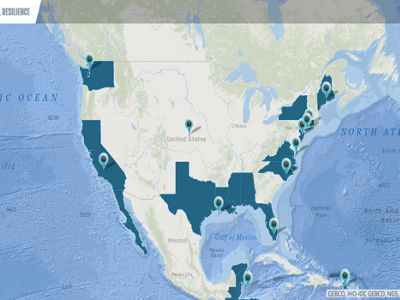
The Coastal Resilience project provides communities with easy access to information to assist in coastal planning and management decisions regarding resources at risk from sea level rise and coastal hazards. This information is accessible through an interactive decision support tool. With the Future Scenarios Mapper, users can characterize current conditions and visualize the ecological, social and economic impacts of reasonable future flooding scenarios. Appropriate planning for adaptation requires data-driven decision support, and the Coastal Resilience project provides a suite of interactive analysis options to support decision-makers.
When should you use it?

  • To view current and future climate scenarios for sea level rise and storm surge along the southern shores of Long Island, New York, USA.
  • To examine spatially-explicit relationships between ecological, social and economic factors from different sea level and storm impacts.
  • To provide potential ecosystem-based adaptation solutions to coastal hazards issues.
  • To provide stakeholder and local communities with easy access to information for their planning, zoning, acquisition and permitting decisions.

For more information about Coastal Resilience:
Public Site:
http://www.coastalresilience.org
Questions? Contact coastalresilience@tnc.org or (203) 568-6296 (Reviewed Feb 2012)


CONNECT

CONNECT is The Nature Conservancy's flagship internal web site, combining the functions of an intranet with a broad information systems platform and a place for TNC staff and partners to collaborate. Access requires a TNC account; staff can use their email address and password but partners must request access to specific areas of CONNECT that they need access to. Eventually there will be a public component of CONNCT as well, similar to the function currently served by ConserveOnline.
When should you use it?

  • To get news about The Nature Conservancy.
  • To find information on TNC staff (via People Search, Profiles, and status updates) and departments.
  • To collaborate (via teamsites) and network with other staff who share similar interests and projects.

For more information about CONNECT:
TNC account required:
https://connect.tnc.org/
Questions? Visit the Connect Resource Center. (Reviewed Jul 2012)


Conservation Action Planning (CAP) Workbook

A Microsoft Excel-based tool developed by the Nature Conservancy to capture information from the Conservation Action Planning (CAP) Process, including developing strategies, taking action, and measuring results. An alternative tool to the workbook is Miradi, which also exchanges data with ConPro.  The latest version of the workbook (v6b) was released in May 2010, and supports new strategy effectiveness information similar to Miradi. The CAP workbook is no longer supported by TNC.
When should you use it?

  • Use it to document and update your Conservation Action Plans, including identifying targets, assessing viability, developing objectives and strategies, and creating monitoring indicators to measure the success of a conservation project.
  • CAP Excel workbook data can be uploaded to ConPro to enable cross-project learning.

For more information about the CAP Workbook:
Public Site:
http://www.conservationgateway.org/file/conservation-action-planning-workbook-version-capv6b
Questions? See the CAP Workbook User Manual (Reviewed Aug 2012)


Conservation Gateway

An online, public resource for the global conservation community to find and share innovations and lessons learned related to the products and practices of Conservation by Design, including Global Science and Indicators, Ecoregional Assessment and Conservation Action Planning (CAP), and Conservation Networks.
When should you use it?

  • To find guidance supporting about all aspects of Conservation by Design - setting goals and priorities, developing strategies, taking action and measuring results.
  • Download educational materials and tools related to CAP and Ecoregional Assessments.
  • Share and learn of best practices and innovations related to all aspects of Conservation by Design.
  • Participate in or begin discussions on topics related to Conservation by Design.

For more information about the Conservation Gateway:
Public Site:
http://www.conservationgateway.org
Questions? Email tjohnson@tnc.org


ConservationEvidence.com

ConservationEvidence.com provides a database of short reports on the effectiveness of conservation practices. The goal of the site is to support decision making in conservation and environmental management. See also the Centre for Evidence-Based Conservation.
When should you use it?

  • Learn which conservation actions are most effective in achieving desired outcomes, i.e. re-introducing native species, restoring habitat, controlling invasive species, etc.
  • Contribute information based on your own experience carrying out conservation interventions – which ones worked and, just as importantly, which ones didn’t work.

For more information about ConservationEvidence.com:
Public Site:
http://www.conservationevidence.com
Questions? Email info@conservationevidence.com (Reviewed Feb 2012)


Conservation Land System (CLS)

The Conservation Land System (CLS) is The Nature Conservancy's system of record for tracking all conservation activities including conservation land and interests held or once held by the Conservancy. The Conservation Information Management (CIM) office within the Legal department provides oversight and guidance for the use of CLS and the business processes and procedures that the system supports. The Conservation Data & Information Systems (CDIS) team is currently leading an effort to link CLS to spatial data managed in the TNC Lands layer.
When should you use it?

  • Find information on TNC's conservation activities such as conservation land or interests held.
  • Edit/update information about tracts or managed areas.
  • Associate spatial data with conservation easements.

For more information about CLS:
TNC account required:
https://connect.tnc.org/Departments/legal/ConservationInformationManagement/Pages/Conservation%20Information%20Management%20%20CLS%20Resources.aspx
Questions? Email kcollins@tnc.org (Reviewed Feb 2012)


Conservation Partnership Center

The Conservation Partnership Center is an interactive, Web-based resource center for conservation practitioners who want to learn how to create and manage more effective partnerships for greater conservation impact. The site is structured around 6 simple steps for entering into and maintaining productive, strategic partnerships. You’ll find a well-organized suite of proven partnership tools, methodologies and best practices representing over 30 years of organizational experience in working with partners, along with selected resources from trusted experts in the field of collaboration.
When should you use it?

  • To get help building, maintaining and ending partnerships.
  • To learn from your colleagues about what tools and strategies have worked to improve their partnerships.

For more information about the Conservation Partnership Center:
Public Site: http://www.conservationgateway.org/ConservationPlanning/partnering/cpc/Pages/default.aspx
Questions? Email conservationgateway@tnc.org (Reviewed Feb 2012)


Data Thief

Data Thief is an invaluable tool for people who want to do their own analysis based on charts or graphs published without also publishing the underlying data. It works best on line graphs, but also works on scatterplots or even bar charts with a bit more work. Essentially you import an image (such as a screen capture), calibrate the axes based on the numbers shown, and then choose the data you wish to import. For line graphs it will trace each line, for other kinds of charts or graphs you need to click on each point you want to capture and it will record the coordinates. You end up with a table of the data underlying the chart you wish to analyze.

This is shareware, it currently costs $25 as of November 2012.
When should you use it?

  • Extract information from a published chart or graph to do your own deeper analysis.
  • Perform a meta-analysis on a range of papers without having to wait for a reply from each author.

For more information about DataThief:
Public Site:
http://www.datathief.org/
Questions? Check the help manual (Reviewed Nov 2012)


Ecoregional Assessment Status Tool (EAST)

The Ecoregional Assessment Status Tool (EAST) is the master location for basic information on ecoregional assessments carried out by The Nature Conservancy and our partners. It is intended to collect information such as the status of ERAs, contact people, data management tools used, etc. The tool can track terrestrial, freshwater, and marine assessments, and currently has about 150 assessments listed.

People in the field who manage ERA data can update the tool directly, and their updates will be used to keep our spatial data current as well. As of April 2011, this system is public.
When should you use it?

  • Find and read ecoregional assessment reports.
  • Find out who within TNC has completed ecoregional assessments, how the assessments were carried out, and which geographies have assessments.
  • Contribute updates on your ecoregional assessments and share them with others.

For more information about EAST:
Public Site:
http://east.tnc.org/
Questions? Email era@tnc.org (Reviewed Feb 2012)


Fire Data Management Tool (FDMT)

The Fire Data Management Tool collects data about TNC's fire management - prescribed burns, wildfires on TNC lands, and actions designed to act as surrogates for the ecological effects of fire. It provides a standard tool which allows fire managers across TNC to document and manage data about their conservation work on the ground, and provides the ability to report on TNC's fire-related activities across the organization, for a specific fire program, or set of fire programs. Fire managers can record information about current fire activities, and have the option to enter historical data in order to document the use of fire on a particular site over time. FDMT was released in May 2008.
When should you use it?

  • Find details on fire management activities for a particular site.
  • Download spatial data about fire management.
  • Get reports on prescribed fire or wildfires for particular fire programs or TNC as a whole.

For more information about FDMT:
Public Site:
http://ecad.tnc.org/FireDataManagementTool/home.aspx
Questions? Email jim_smith@tnc.org (Reviewed Feb 2012)
 

Gap Light Analyzer (GLA)

GLA is free imaging software to extract forest canopy structure and gap light transmission indices from true-colour hemispherical (fisheye) photographs. It includes "region of interest" image-processing functions: e.g., image threshold, brightness, contrast, colour fill, etc. It also provides a number of stand-alone utilities that will compute and display daily extraterrestrial radiation, sunfleck duration and frequency distribution, solar positions and intensities, and sky-region brightness.
When should you use it?

  • Import, display, and analyze digital hemispherical canopy images.
  • Process large numbers of photographs taken from numerous sites - individual configurations can be created for different camera lenses and orientations, regional climatic patterns and growing seasons, and topographic settings.
  • Extract canopy structure data (gap fraction, canopy openness, effective LAI) and gap light transmission indices.

For more information about the GAP Light Analyzer:
Public Site:
http://ecostudies.org/gla/
Questions? Email gfrazer@islandnet.com (Reviewed Aug 2010)


GIS Listserv

The GIS listserv is a great place to ask your colleagues about anything related to GIS: where to find data, hardware or software problems/recommendations, job postings, and more. Note that this listserv is not limited to TNC staff, so please do not post sensitive information here. Although part of conserveonline, the web site requires a separate login to be created. If you have something to post to the listserv please use the website, as writing email messages to the listserv often does not work. You may also wish to join the listserv or forums of the Society for Conservation GIS.

To join the listserv, go to the web site listed below, sign up for an account (click new user), then click the link at left that says "subscribe to mailing list" and put a check next to "Geographic Information Systems (private)" to indicate that you want to join. Note that if you wish to post a new message doing so via email usually doesn't work, you have to use the web form. Also note when replying to messages that the default is to reply to the whole listserv, if you wish to reply only to the sender check your "to" field before sending.
When should you use it?

  • Get help on questions regarding GIS analysis, data, software, etc.
  • Stay current with new tips, resources, and ideas.
  • Contribute to TNC's GIS community and get to know some of the people and how they're using GIS.

For more information about the GIS Listserv:
Public Site:
The GIS listserv is currently down. Stay tuned!
Questions? Email chughes@tnc.org (Reviewed Feb 2012)


Google Earth

Google earth is a free application similar to ArcGIS Explorer that provides an easy to use way to view and share spatial information. It provides 3D views and aerial photography for you to layer your data with, and it allows you to add kml/kmz files, or a variety of other custom content. It comes with a lot of data loaded in by default, but to be able to add shapefiles or raster data you need the Pro version.

The process to apply for a free Pro license has changed, you should now go to http://services.google.com/googlegrants/earth_application and fill out the form. Do not download the trial version of google earth pro before filling out the form. You will need to explain how you plan to use the software, and provide TNC's taxpayer ID in your request. In most cases, you will be granted a free license for one year, which can then be renewed.
When should you use it?

  • Share interactive spatial data with people who do not have ArcGIS Desktop or are unfamiliar with GIS.
  • Create 'flyovers' or animations showing your data in a 3D landscape.
  • Compare or "mash up" various data sources available online as web services, add your local shapefiles (if you have the Pro version).

For more information about Google Earth:
Public Site:
http://earth.google.com/.
Questions? Check the support site for Google Earth (Reviewed Jul 2010)


Indicators of Hydrologic Alteration (IHA)

The Indicators of Hydrologic Alteration (IHA) is a software program that provides useful information for those trying to understand the hydrologic impacts of human activities or trying to develop environmental flow recommendations for water managers. Nearly 2,000 water resource managers, hydrologists, ecologists, researchers and policy makers from around the world have used this program to assess how rivers, lakes, and groundwater basins have been affected by human activities over time, or to evaluate future water management scenarios.

This program was developed by scientists at the Nature Conservancy to facilitate hydrologic analysis in an ecologically-meaningful manner. This software program assesses 67 ecologically-relevant statistics derived from daily hydrologic data. For instance, the IHA software can calculate the timing and maximum flow of each year’s largest flood or lowest flows, then calculates the mean and variance of these values over some period of time. Comparative analysis can then help statistically describe how these patterns have changed for a particular river or lake, due to abrupt impacts such as dam construction, or more gradual trends associated with land- and water-use changes.

When should you use it?

  • Investigate the hydrologic impacts of human activities.
  • Develop environmental flow recommendations for water managers.
  • Calculate the characteristics of natural and altered hydrologic regimes.

For more information about IHA:
Public Site:
http://conserveonline.org/workspaces/iha
Questions? Email jlimbrunner@hydrologics.net (Reviewed Jan 2012)


Impervious Surface Analysis Tool (ISAT)

The Impervious Surface Analysis Tool (ISAT), which is available as a free extension for ArcGIS or ArcView, is used to calculate the percentage of impervious surface area within user-selected geographic areas (e.g, watersheds, municipalities, subdivisions). In small watersheds, the correlation between an increase in impervious surfaces and a decrease in water quality has been well established. People use the information derived from ISAT to predict how different management scenarios might impact local water quality.
When should you use it?

  • Calculate the percent impervious area and total impervious surface area of each selected polygon.
  • Categorize polygons to represent conditions of good, fair, and poor water quality based on calculated imperviousness.
  • Incorporate land cover change scenarios to examine how changes influence impervious surfaces.

For more information about the Impervious Surface Analysis Tool:
Public Site:
http://www.csc.noaa.gov/digitalcoast/tools/isat/index.html
Questions? Contact the NOAA Coastal Services Center. (Reviewed Aug 2010)


INFFER

For environmental managers everywhere, the biggest and most perplexing question is often 'where should I spend the few dollars that I have to get the best environmental outcomes?' INFFER (INvestment Framework For Environmental Resources) is a framework specifically developed to help answer this question. INFFER gives decision makers the ability to assess one project against another, comparing aspects such as value for money, degrees of confidence in technical information and the likelihood of achieving stated goals. It takes the guess work out of resource allocation and creates confidence in decisions made that has, until now, often been absent.

Some key characteristics of INFFER: It is comprehensive - users are guided throughout the process and given all the tools required to complete each step. It actively encourages community and stakeholder consultation at the project development stage. It requires the setting of clear and measurable goals which then underpin the entire planning and assessment process. It is asset-based and makes use of best available science. It considers and attempts to measure community support for, and interest in, the proposed project. Finally, it provides an indication in dollars of the anticipated costs associated with proposed projects, allowing organisations to budget well into the future.
When should you use it?

  • Establish priorities for internal funds and prepare proposals to acquire external investment
  • Assist with the development of action plans, or less frequently, to develop an overall investment plan or strategy for the region.
  • Develop a stock of projects that address key environmental assets

For more information about INFFER:
Public Site:
http://www.inffer.org/.
Questions? Check the INFFER FAQ page (Reviewed Oct 2011)


Invasive Plant Management Decision Analysis Tool (IPMDAT)

The purpose of the Invasive Plant Management Decision Analysis Tool (IPMDAT) is to assist The Nature Conservancy (TNC), as well as partner agencies and organizations, in deciding if an invasive plant management project is likely to be successful. A successful invasive plant management project should not only control an invasive plant, it should also achieve conservation goals such as maintaining or restoring the viability/health/resilience of desired species, natural communities, and/or ecosystem processes.

The IPMDAT may also be used in cases where the invasive plant species threatens economic or human health, recreational use, or meeting legal obligations. The IPMDAT is comprised of a strategy-selection decision tree and three control-strategy decision trees (eradication, containment/exclusion and suppression) as well as associated worksheets and documentation. The strategy selection tree is used to determine if the harm caused by an invasive plant species is significant enough to warrant control. Then the tree is used to identify the appropriate control strategy based on the abundance and distribution of the invasive plant.

When should you use it?


  • Deciding if an invasive plant management project is likely to be successful
  • Identify the best control strategy (eradication, containment/exclusion, or suppression) based on the abundance and distribution of the invasive plant

For more information about IPMDAT:
Public Site:
http://conserveonline.org/library/an-invasive-plant-management-decision-analysis/view.html.
Questions? Email czimmerman@tnc.org (Reviewed Oct 2011)


InVEST

InVEST (Integrated Valuation of Ecosystem Services and Tradeoffs) is a family of tools to map and value the goods and services from nature which are essential for sustaining and fulfilling human life. Government officials, conservation professionals, farmers, and other land owners make decisions about how to use their land all the time. Yet, never before have any of these groups had a systematic way to demonstrate the future costs and benefits of their decisions for people and the environment. In its most ground-breaking effort, the Natural Capital Project aims to meet this challenge with InVEST, a new tool that can model and map the delivery, distribution, and economic value of life-support systems (ecosystem services), well into the future. The tool helps users visualize the impacts of potential decisions, identifying tradeoffs and compatibilities between environmental, economic, and social benefits.
When should you use it?

  • Model and map the consequences of decisions on life-support systems in both economic and biophysical terms
  • Identify where ecosystem service benefits originate and where they are consumed
  • Answer questions like "Where would reforestation achieve the greatest sustainable timber production and value for carbon sequestration and crop pollination?"

For more information about InVEST:
Public Site:
http://www.naturalcapitalproject.org/InVEST.html
Questions? Check the InVEST collaboration page (Reviewed Jan 2012)


LANDFIRE

Don’t be put off by the name - it is not just about fire! The LANDFIRE project provides wall-to-wall vegetation related spatial data and ecological models for the entire United States. LANDFIRE products include over 1,500 vegetation dynamics models and over 20 digital maps of existing vegetation, pre-European-American settlement vegetation (called Biophysical Settings), vegetation height and cover, estimated historical fire regimes and current departure from estimated historical vegetation conditions. The consistent and seamless nature of LANDFIRE datasets make them a useful tool when working on large landscapes with multiple ownerships where no other local datasets cover the entire area of interest. LANDFIRE products were designed for national and regional level applications, decision making and strategic planning. Project products may not be appropriate to use on small landscapes. As with any data product, it is recommended that users review the data carefully and understand its content before using it. 

When should you use it?

  • Identify and quantify ecological targets
  • Determine reference conditions
  • Assess threats to conservation and management targets
  • Evaluate strategies to abate threats and maintain or restore biodiversity
  • Evaluate ecological departure from reference conditions
  • Prioritize areas for treatment and restoration activities
  • Measure results
  • Communicate with stakeholders
  • Make maps

For more information about LANDFIRE:
Public Sites:
LANDFIRE Program Home and LANDFIRE on Conservation Gateway
Questions? Email Program Manager Jim Smith (Reviewed Nov 2016)

Map of Life

By bringing together all types of information about species distributions, providing model-based integration, and providing a system for users to build upon our knowledge, the Map of Life project hopes to support our community in understanding and saving the world's biodiversity. The result will ultimately be a knowledge-base and platform for species distribution map development, along with a set of tools for querying, accessing, downloading and summarizing them.
When should you use it?

  • View species distributions from multiple data sources on a single map.
  • Search within a geographic location to see what species occur there (e.g. find all reptiles within a 50 km radius).
  • Note that as of September 2012 the site is an unfinished proof of concept.

For more information about the Map of Life:
Public Site:
http://www.mappinglife.org/
Questions? Click "Help" on the left side of the map page (Reviewed Sep 2012)


Marine Conservation Agreements – A Practitioner’s Toolkit

Marine Conservation Agreements (MCAs) include any formal or informal understanding in which one or more parties commit to delivering explicit economic incentives in exchange for one or more other parties committing to take certain actions, refrain from certain actions, or transfer certain rights and responsibilities to achieve agreed-upon ocean or coastal conservation goals. The Practitioner's Toolkit for Marine Conservation Agreements was developed to help conservation organizations determine: what MCAs are; when MCAs can help abate threats to ocean and coastal species, habitats, and ecosystems; and how to plan and proceed with MCA projects.
When should you use it?

  • Coastal and marine field practitioners can use the toolkit to help them evaluate, plan, and implement MCA projects.
  • Policy makers and decision makers can use the toolkit to find out how different countries and U.S. states address private conservation of the ocean and coastal areas.
  • Academic researchers can use the toolkit to find information related to private marine conservation efforts, spatial data depicting ownership and use in the marine environment, and the results of related research.

For more information about the MCA Toolkit:
Public Site:
http://www.mcatoolkit.org/
Questions? Email mcatoolkit@tnc.org (Reviewed Feb 2012)


Marine Ecosystem-based Management Toolkit

The aim of this toolkit is to guide managers and practitioners in the use of common tools for regional planning and to illustrate through case studies approaches to advance ecosystem-based management by jointly addressing multiple objectives in conservation, fisheries and coastal hazards.
When should you use it?

  • Find guidance and tools supporting the application of a planning process in the marine environment to achieve biodiversity conservation and other objectives.

For more information about the Marine Ecosystem-based Management Toolkit:
Public Site:
http://www.marineplanning.org/
Questions? Email marine@tnc.org (Reviewed Feb 2012)


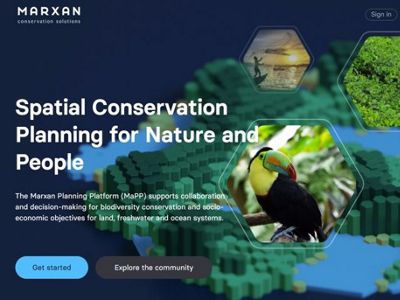
MARXAN

Marxan is software that delivers decision support for reserve system design (e.g. for designing a portfolio as part of an ecoregional assessment). Marxan finds reasonably efficient solutions to the problem of selecting a system of spatially cohesive sites that meet a suite of biodiversity targets. Given reasonably uniform data on species, habitats and/or other relevant biodiversity features and surrogates for a number of planning units (as many as 20,000) Marxan minimizes the cost (a weighted sum of area and boundary length, Possingham, Ball and Andelman 2001) while meeting user-defined biodiversity targets.
When should you use it?

  • Design a portfolio as part of an ecoregional assessment.
  • Explore alternate scenarios and factors to see how they would affect your results.

For more information about MARXAN:
Public Site:
http://www.uq.edu.au/marxan/
Questions? Email h.possingham@uq.edu.au or m.watts@uq.edu.au (University of Queensland) (Reviewed Feb 2012)


Metadata Standards for TNC

This web site has the TNC Metadata Content Standard, as well as metadata templates, tools, training resources, and examples. For staff who are unfamiliar with metadata or have not developed it yet for their datasets, this is an excellent place to start.
When should you use it?

  • As a resource when creating new metadata (i.e. you can use a template to get started and guidance on how to proceed).
  • Update your existing metadata to be more useful by bringing it into compliance with the TNC standard.
  • Learn more about what metadata is and why it's important.

For more information about Metadata Standards for TNC:
Public Site:
http://conserveonline.org/workspaces/metadata
Questions? Email core_data@tnc.org (Reviewed May 2010)


Miradi

Miradi is a user-friendly conservation planning software program. It is a bit like TurboTax, guiding conservation practitioners through a series of step-by-step interview wizards which help them to define their project scope, design conceptual models of the targets at their site and factors affecting them, prioritize threats, develop objectives and actions, and select monitoring indicators to assess the effectiveness of their strategies. Miradi also supports the development of workplans, budgets, and other tools to help practitioners implement and manage their project. Users can easily export Miradi project data to donor reports or to a central database to share their information with other practitioners. Miradi has released version 2.2, and TNC has an organization al license to use it. See below for instructions on how to get Miradi.
When should you use it?

  • This tool walks you through the conservation planning process, similar to the CAP workbook.
  • Advantages of Miradi include the ability to create built-in conceptual models and “results chains” documenting the relationships between conservation strategies and hoped-for biodiversity outcomes.
  • Miradi data can be loaded to the Conservation Project (ConPro) database to enable cross-project learning.
  • You can convert your CAP workbooks to Miradi format via ConPro

For more information about Miradi:
Public Site:
https://miradi.org/
For instructions on how to get Miradi using TNC's license (for TNC staff or partners collaborating with TNC staff on a conservation project only):
TNC Account required:
https://connect.tnc.org/Departments/CentralScience/DataInformationSystems/PolProc/instructions_for_miradi_download_by_tnc_users.pdf
For more Miradi resources (including a tutorial):
Public Site:
http://conserveonline.org/workspaces/Miradi
Questions? Email info@miradi.org (Reviewed Feb 2012)


Protected Areas Resources

Protected Areas Resources contains information, tools and resources to help practitioners and policy makers implement the Convention on Biological Diversity's Program of Work on Protected Areas.
When should you use it?

  • Find information on the Convention on Biological Diversity’s Program of Work.
  • Access resources and guidance supporting the development of master plans and gap analyses and the assessment of threats, management effectiveness, capacity, governance, sustainable finance and monitoring.

For more information about Protected Areas Resources:
Public Site:
http://conserveonline.org/workspaces/patools
Questions? Email jervin@sover.net (Reviewed Feb 2008)


Protected Area Tools (PAT) for ArcGIS

The Protected Area Tools (PAT) for ArcGIS are a suite of tools designed as part of an ongoing process to help build GIS technical capacity in countries seeking assistance in identifying and filling protected area gaps. These tools permit the calculation of complex conservation models within an easy-to-use interface. The latest release of PAT provides a variety of new features, including compatibility with Zonae Cogito, new decision support system developed by Watts et al (2009) for the family of Marxan software.
When should you use it?

  • Developing a customized Environmental Risk Surface (ERS) based on mapped risk elements (i.e. socioeconomic activities).
  • Calculating a land or seascape’s Relative Biodiversity Index (RBI), which estimates relative biological richness, measured in terms of biodiversity feature abundance in comparison to the overall study area.
  • Creating input files for use in Marxan and providing users an easy way to manipulate input parameters and review various conservation scenarios in order to achieve an optimal configuration of protected areas that meet user defined conservation goals.

For more information about Protected Areas Tools (PAT) for ArcGIS:
Public Sites:
http://www.gispatools.org
For a tutorial on how to use Protected Areas Tools (PAT) for ArcGIS:
https://nethope.webex.com/nethope/k2/e.php?AT=RINF&recordingID=57686987 (part 1)
https://nethope.webex.com/nethope/k2/e.php?AT=RINF&recordingID=57687162 (part 2)
Questions? Email sschill@tnc.org (Reviewed Dec 2009)


SaveDBF (Excel add-in)

SaveDBF is an add-on product to Excel 2007 or 2010 for easy editing and management of large dbf files (which Excel used to support until 2007). This is of particular interest to GIS users who need to modify the attributes of a shapefile outside of ArcGIS. The developer, Gyula Gulyas, has graciously donated an enterprise license for TNC employees; non-TNC staff can obtain it by contacting the developer for pricing options. TNC staff can contact TIS Procurement (tispal@tnc.org) to request your free license and software. Instructions for installing the add-on and learning the features can be found at: http://www.youtube.com/watch?v=sj8rkHxUboU.
When should you use it?

  • Quickly and easily modify the attributes of a shapefile in Excel
  • Save any spreadsheet as a dbf
  • Avoid the pitfalls of working directly with Excel files in ArcMap

For more information about SaveDBF:
Public Site:
http://thexlwiz.blogspot.com/
TNC staff only:
Request your free copy from TIS Procurement (tispal@tnc.org)
Questions? Email gygulyas@yahoo.ca (Reviewed Feb 2012)


Science Chronicles

The Science Chronicles is an unofficial, monthly newsletter for the science-minded conservationist. The Chronicles features lively discussion of science and conservation issues. To subscribe, contact the helpdesk (helpdesk@tnc.org) and ask to be added to the Science Chronicles distribution list.
When should you use it?

  • Learn about recent "hot topics" that Conservancy scientists are thinking about.
  • Get a different perspective than the "official" communication channels at TNC.

For more information about the Science chronicles:
Public Site:
http://www.conservationgateway.org/science-chronicles
Questions? Email rlalasz@tnc.org (Reviewed Feb 2012)


Scientific Journals

The Central Science department and TIS maintain online subscriptions to peer reviewed, scientific journals. These can be accessed through Connect if you are logged in with an account associated with a TNC email address.
When should you use it?

  • Access scientific journals to do research or just stay current with recent work.

For more information about Scientific Journals:
TNC Account required:
https://connect.tnc.org/Conservation/learning/Pages/Scientific-Journals.aspx
Questions? Email kburford@tnc.org (Reviewed Aug 2012)


Spatial Portfolio Optimization Tool (SPOT)

The Spatial Portfolio Optimization Tool (SPOT) is a generalized tool for conservation portfolio selection, using a flexible approach to automatically design an efficient portfolio around specified conservation goals. It is based off of SITES, an earlier planning tool.
When should you use it?

  • Design a portfolio as part of an ecoregional assessment.

For more information about SPOT:
Public Site:
http://conserveonline.org/workspaces/spot/
Questions? Email mbennett@tnc.org (Reviewed Jan 2008)


Statistical Software (SAS and JMP)

TNC staff can obtain free copies of SAS or JMP statistical software by request at the TNC intranet site listed below.  Free training for this software is available by calling 1-800-333-7660 and identifying yourself as a TNC employee.  TNC staff should NOT buy services from SAS or JMP as this violates the term of our software donation.
When should you use it?

  • Run statistical analysis for a variety of purposes.

For more information about Statistical Software:
TNC account required:
https://connect.tnc.org/Departments/TechnologyInformationSystems/TISDO/Pages/Donated-Software.aspx
Questions? Email tispal@tnc.org (Reviewed Jun 2012)


Technology Blueprint

The TNC Technology Blueprint is a framework to enable TNC staff to find a solution to meet their technology need. Use this self service tool as a roadmap to determine whether a solution/tool exists for your needs, or you need to create a new solution (whether in collaboration with your TNC community, in collaboration with TIS, or in collaboration with an external resource). The main function is the “Technology Solutions and Tools List”; a collection of existing tools & solutions (similar to the list on this page) that are in various phases of development and use. Use this list as a resource to find, to share, and to discuss what is already in use, what others have built, or are in the process of building, so that you can adapt and/or re-use for your needs. Note that you must log in with your TNC email address and password to view this site.
When should you use it?

  • Find existing tools, including unfinished ones
  • Get help deciding whether an existing tool can meet your needs or you need a new one

For more information about the Technology Blueprint:
TNC email login required:
https://connect.tnc.org/teamsites/tis/blueprint/default.aspx
Questions? Email nsimonson@tnc.org (Reviewed Nov 2010)


Terra-i

Terra-i is an interactive map-based monitoring platform for viewing data on habitat loss across terrestrial Latin America in near-real time. It is the result of a collaborative project between The Nature Conservancy (TNC), the International Centre for Tropical Agriculture (CIAT), University of Applied Sciences of Western Switzerland (HES-SO) and King's College London (KCL).
When should you use it?

  • Analyze where habitat loss has occurred in Latin America over the past several years.
  • Identify areas of new habitat loss quickly and be able to respond appropriately.

For more information about terra-i:
Public Site:
http://www.terra-i.org/
Questions? Use their contact form (Reviewed Sep 2010)


TNC Maps (maps.tnc.org)

TNC Maps serves as a place to find a variety of spatial data and interactive maps for The Nature Conservancy. Information is available about the core conservation data sets (ecoregional assessments, ecoregional portfolio, conservation projects, and TNC lands), as well as interactive web maps from all over the Conservancy.
When should you use it?

  • View or download TNC's core conservation data.
  • Explore interactive web maps on a variety of topics from around the world.
  • Get assistance finding or publishing spatial data.

For more information about TNC Maps:
Public Site:
http://maps.tnc.org/
Questions? Email jon_fisher@tnc.org (Reviewed Jul 2012)


Weed Information Management System (WIMS)

TNC's Weed Information Management System (WIMS) is a Microsoft Access-based relational database application that is designed to assist natural resource managers in managing their weed data. WIMS keeps track of three types of data records: weed occurrences (GPS point locations), assessments (size and status of the weed infestation to facilitate monitoring over time), and management treatments applied to those weed infestations. Data can be easily exchanged between multiple users, exported in NAWMA (North American Weed Management Association) standards, and written to shapefiles for mapping in any standard GIS program. A variety of reports can also be easily generated. Additionally, WIMS can be used on a handheld unit (either MS Windows-based Pocket PC or Trimble) with a GPS unit to capture data in the field. When using WIMS on a handheld unit with an ArcPad interface, a site manager can use background imagery and other GIS layers for mapping weeds, then upload the new data into the Access database with a few mouse clicks!

Since the Global Invasive Species Team has been dismantled, WIMS is no longer officially supported, it is still available.
When should you use it?

  • Keep track of both the current status of invasive species in an area and changes in distribution over time.
  • Analyze and report on the invasive species present and conservation actions taken to alleviate them.

For more information about WIMS:
Public Site:
http://www.imapinvasives.org/GIST/WIMS/index.html
(Reviewed Apr 2008)

GO BACK »