Introduction
In Hydropower by Design, consequences to stakeholder interests, resulting from hydropower development options, are assessed by measuring characteristics such as energy generation, project costs, and impacts to social, environmental, and economic metrics. These consequences are a function of dam projects, and their sites, which determine proximal and downstream effects of dam reservoirs, associated infrastructure, and operations. Tradeoff analysis is then performed to compare how and to what degree different development options affect these stakeholder interests. For instance, a given development option might have beneficial and/or few negative impacts on some stakeholder interests, while resulting in significant negative impacts on others. While the overall approach of assessing consequences and tradeoffs requires continuous engagement with stakeholders and decision makers, this component focuses on the specific technical aspects of data management, analyses, and presenting and interpreting tradeoff results.
These processes can be carried out using several analytical approaches and tools. Understanding the technical aspects of each is critical to producing results that provide stakeholders with information that is accurate and useful to them. This component explains the steps needed to generate quantitative results to compare development options, and ways that an array of complicated and voluminous results can be presented to stakeholders and decision makers in a manner that is valuable to them. While this component intends to be expansive in the description of approaches and tools, the technical efforts for any given place should not be limited to those that are summarized below; if alternatives are available and provide better or more easily understood and accepted results by decision makers and stakeholders they should be used.
The goal of conducting an HbD analysis should be clear before starting. Some efforts are intended to generate products as illustrative examples of the HbD approach only, as can be seen in the case study System Scale Hydropower Planning in Myanmar: An Illustrative Approach to demonstrate to stakeholders and decision makers the possibilities that can emerge from these analyses and how they can be used to inform decisions. Such approaches may focus on a limited geography, a small subset of potential new dams, or an incomplete set of metrics as opposed to a more extensive effort and comprehensive set of products intended to support actual decisions. Time, capacity, data availability, and funding constraints may also affect the sophistication and breadth of analyses. We provide here the steps and a variety of ways to conduct and illustrate portfolio tradeoff analyses, and leave the selection of approaches and analyses to the user to decide based on the parameters of their project.
Overview
This component summarizes the major steps and approaches for assessing development options and quantifying tradeoff results. The following is addressed in this component:
- Defining the portfolio
- Identifying the infrastructure footprint of a portfolio
- Evaluating additive attributes of dams independent of infrastructure footprints in portfolios
- Evaluating the impacts of infrastructure footprints in portfolios
- Evaluating the impacts of dam development on economic attributes
- Illustrating Portfolio tradeoffs
Best Practices
Hydropower by Design processes strive to help stakeholders identify future hydropower systems that are in the best public interest. The approach, therefore, takes a broad view of the positive and negative impacts of hydropower development alternatives. These impacts need to be understood for the geography and system that is being studied. The following recommended best practices highlight steps and approaches which have had proven effective in assessing development options and illustrating tradeoff results:
Defining the portfolio
A portfolio represents a unique combination of locations, characteristics, operations, and associated infrastructure (if information and capacity allows) of potential future dams in a basin in addition to the current dams and those under construction (the baseline condition). Portfolios serve as the units of analysis in the assessment of collective and cumulative consequences resulting from a suite of dams. An HbD analysis will produce quantitative results for each portfolio for energy generation, costs, and economic impacts, and a spatial “footprint†resulting from dam locations, reservoir extents, operations (if included), and associated infrastructure such as roads and transmission lines (if included). Each portfolio will have a set of distinct values calculated for metrics that represent stakeholder interests.
The definition of potential future dams that will be selected from for portfolio development can vary depending on the situation.
For instance, the scope of an analysis may focus on a suite of potential sites that have already been identified through an initial screening of energy generation and costs, and are in line for further evaluations and consideration for development. “Planned†dams may define those that are in the process of development, and site-level evaluations and licensing are the only steps that may interrupt their development. Alternatively, some situations may include all sites identified in field surveys for potential hydropower development, with no subset of dams yet selected. This latter situation offers the largest number of potential future hydropower development options and more alternatives to compare among and, thus, provides greater opportunity for identifying additional portfolios with results that may be more acceptable to a broader set of stakeholders. This situation also offers the opportunity to inform the selection of a sub-set of potential dams for inclusion in any given development process, and hence, a more comprehensive HbD process.
| Dam Development Stage |
| In Operation |
| Under Construction |
Environmental License, Joint Venture Agreement |
Feasibility Study, Memorandum of agreement |
| Memorandum of Understanding |
Planned/Proposed by
Developer |
Example of classification of dam status (The Nature Conservancy, WWF, and the University of Manchester (2016).
Building Blocks of a Portfolio
All Portfolios require a basic set of information about existing dams, dams that are under construction and dams that are potential future projects. The potential future locations of dams and their associated reservoirs are the basic variables that change to generate different portfolios and are therefore added to the existing and under construction dams and their reservoirs in the study area.
A selected suite of dams and their reservoir locations define the basic structure for any given portfolio. However, there are several attributes of dams and associated infrastructure that may have alternatives, and can vary for any dam or set of dams. Such variation for any individual dam incorporated into an analysis would result in a distinct portfolio for a given set of dams and reservoirs. Potential additional variables for the suite of dam projects that could result in creation of more portfolios include
Spillway height and operational alternatives, as these may vary for any given dam project and have different consequences to stakeholder interests.  Spillway heights affect characteristics of reservoirs and energy generation capacity, while operations influence downstream flows and energy generation.  In addition, alternative locations of associated infrastructure, such as access roads for dam construction, maintenance, operations, and transmission lines to make electricity accessible to the energy grid may be variables as well.
If these additional variables are available, they can be used to strengthen results by representing more alternatives for dam development and hence a broader range of portfolios for analysis of impacts and consequences to stakeholder interests.
Identifying the infrastructure footprint of a portfolio
The attributes described above identify the requirements to estimate a basic direct spatial infrastructure footprint of dams. This footprint can be used to evaluate non-synergistic, cumulative results of dam development portfolios; inundation by reservoirs; alterations of landscape features from dams and associated infrastructure, and impacts to river network connectivity.
Estimating the direct spatial footprint
An example of generating the direct infrastructure footprint for assessing portfolios.
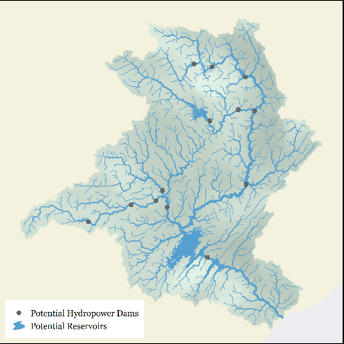
Existing and potential dam locations and associated reservoirs.
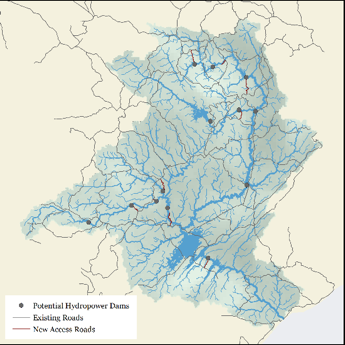
Existing and future projected access roads.
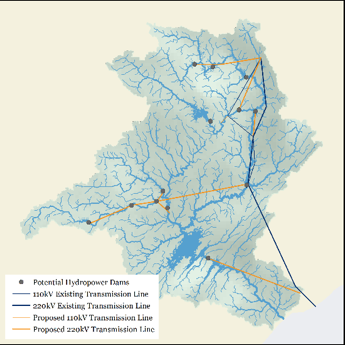
Existing and future projected transmission lines.
Reservoir: Although spatial analyses can estimate reservoir extent and volume in a GIS, the information obtained from engineering designs, such as reservoir footprints (length, area, volume), or full supply level, is more accurate. If not available, reservoir footprints can be estimated using dam locations on a hydrographic network, dam spillway heights, and Digital Elevation Model (DEM) data.
A step-wise approach to modeling reservoir footprint
- Fill the DEM to remove any pits that are artifacts
- Generate flow direction and flow accumulation rasters from the DEM
- Ensure that the dam point falls on the “channel†of the river, as represented in the flow accumulation raster
- Generate the upstream watershed for the dam location. Limit all further analyses to within this watershed
- Find the reservoir surface elevation. Ideally this is provided from engineering documents (often termed the FSL, or full supply level). If it is not given, it can be estimated from the dam height added to the ground surface elevation at the dam location. *Caution: hydraulic head is not necessarily the same as dam height as water is often diverted to a powerhouse some distance downstream of the dam. If the hydraulic head is used as the dam height it can substantially overestimate the reservoir extent
- Reclassify the DEM so that any values within the dam’s watershed that are less than the FSL are assigned the value of the FSL.
- Run a cut/fill analysis to calculate the volume of the reservoir as the difference between the FSL and the original DFEM surface
Associated Infrastructure: If new road and transmission line locations for future dam sites have not been developed, locations can be estimated by generating simple models in a GIS that connect existing roads and transmission lines to potential future dam sites using a DEM for estimating road locations, and dam-to-dam line generation for transmission lines as initial estimates.
Modeling associated infrastructure routes
Transmission line locations which generally cut across the landscape without significant regard for topography can be estimated by connecting a dam location to the nearest existing transmission grid line or, preferably, substation using a straight line. This can be done manually very quickly for even a moderate number of dam locations or scripted for a larger number of dams using common GIS packages.
Roads generally follow the contours of the terrain. One potential approach to estimate new roads is to use a Least Cost Path between the dam location and the nearest road where the dam location and point on the nearest road form the two end points and a slope raster (derived from a DEM) is the cost surface. See Creating the Least Cost Path for more information on running a least cost path analysis in ArcGIS.
Estimating the downstream footprint
Different spatial configurations and operations of dams can also affect the scope and degrees of alteration to downstream flow, sediment, and nutrient dynamics. These changes will generally have impacts on many interests to stakeholders. The downstream scope of alteration is a critical component of the infrastructure footprint of each portfolio. This has been described as the shadow of dam development (Richter et al. 2010).
Downstream changes to flow, sediment and nutrient dynamics, among other changes occur as a function of dam structure, flow management, water withdrawal from reservoirs, evaporation, and reservoir volume residence time. “Run of the river†dams are often considered to have no impacts on flow, and measured on an annual basis. However, they are often managed for daily energy peaking, and affect flows on a daily basis resulting in significant alterations to riverine and floodplain habitats, which subsequently affect biota and environmental services dependent on them
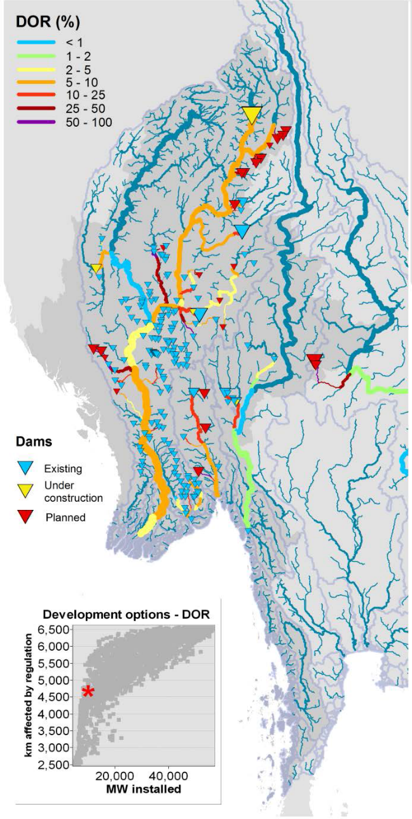
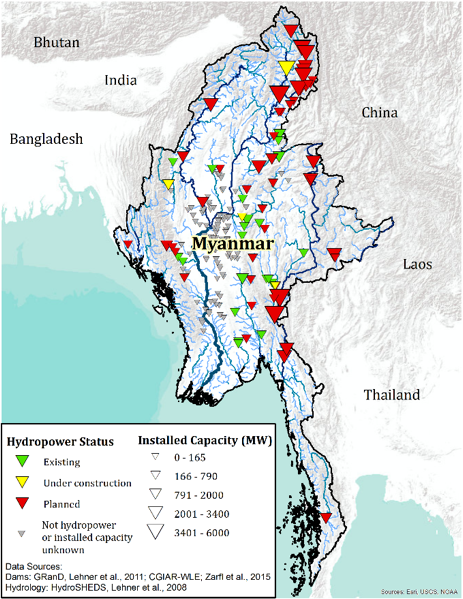
Footprint and degree of flow regulation in rivers for existing dams, under construction, and a hypothetical suite of proposed dams in the Irrawaddy River basin, Myanmar. (Courtesy of Grill and Lehner).
The scope and degree of downstream alterations for any given portfolio can be assessed using several approaches. Read More
The degree and scope of downstream alterations for any given portfolio can be assessed using climate, flow, sediment and nutrient loading data with a variety of analytical approaches. The Degree of Regulation (DOR, Lehner et al. 2011) is a simple way to estimate potential downstream flow alteration. DOR is expressed as the percentage of flow that can be withheld in the dam’s reservoir. For each stream reach, this metric assesses the portion of a given river reach’s mean annual flow to be potentially stored in upstream reservoirs. A river reach with no upstream reservoirs would have DOR of 0 while a reach whose entire annual flow could be potentially stored in upstream reservoirs would have a DOR of 100. Importantly, the DOR is a measure of potential flow alteration. The actual operations of the upstream dams could mitigate or exacerbate the actual flow alteration at any given reach. The extent of river reaches that exceed a given DOR threshold is defined as the downstream scope of flow alteration, and can in turn be used to assess impacts to social or environmental resources of interest. For more information see: http://www.sima-magdalena.co (coming soon).
River simulation models allow for sophisticated analyses that can incorporate flow and dam operating rules, provide accurate and precise estimates of the spatial extent and degree of downstream alterations, and can evaluate synergistic impacts from multiple dams and assess changes to different aspects of downstream alterations. Results from any of these approaches can be displayed spatially to illustrate the extent of river network and floodplain potentially affected by downstream flow alterations. The results from these analyses represent the downstream footprint of flow alteration for a given portfolio.
Synergistic effects of downstream alteration from multiple dam locations and operations can result in even larger alterations to a downstream section of river when two tributaries that have alterations are magnified downstream below where the tributaries meet, as seen in the figure above. Evaluating these attributes can highlight more cumulative alteration below a given dam than would be expected by looking at dams and downstream alterations on an individual basis. For more information see: The Power of Rivers: A Business Case, and the tools WEAP and SWAT in the Resources section of this website.
Alterations to sediment dynamics
Similarly, alterations to sediment dynamics can be mapped and represented as a footprint of a dam development portfolio. There are several approaches to estimating the scope of downstream sediment alteration. Reservoir length, volume, turnover rate, sediment loading, flow, and dam attributes can be used estimate course and fine sediment capture. The figure below represents results from a simple modeling method estimating sediment transport disruption. For more information see: http://www.sima-magdalena.co (coming soon).
Such methods do not take into account the complex and cumulative dynamics of changes to scouring, sediment suspention and transport affected by alterations of flow and sediment capture, which are critical in many systems, yet are difficult to model and quantify in a portfolio analysis. Mapping the scope and degree of sediment alteration should therefore be considered of limited accuracy, and used as an indication of relative potential differences in portfolios.
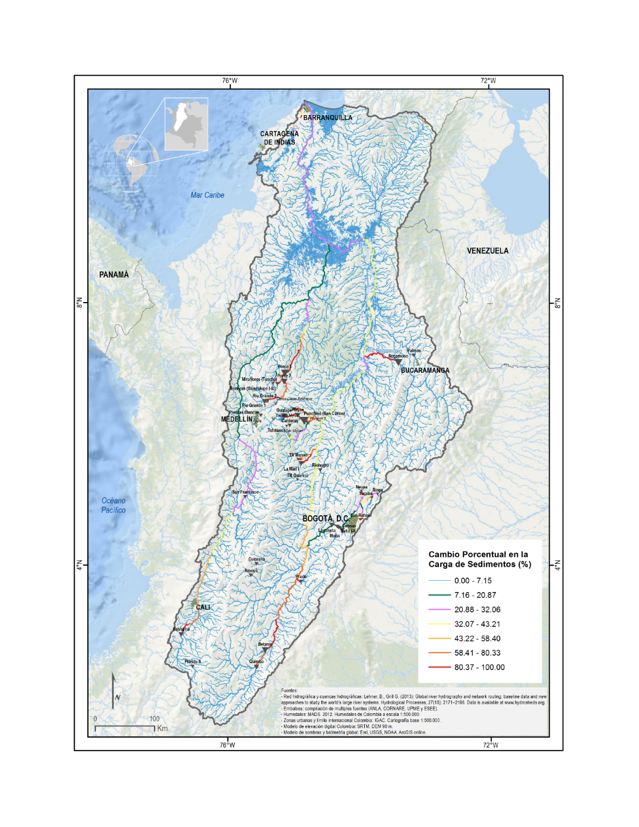
Footprint and degree of sediment alteration from existing dams, Magdalena River, Colombia. (Courtesy of The Nature Conservancy, Colombia).
Evaluating additive attributes of dams independent of infrastructure footprints in portfolios
Many attributes of dams in a portfolio may be additive, and can be evaluated without spatial analysis, as they are independent of the number and locations of other dams. Such attributes may include: the total energy generation and capacity achieved for a given geography, total levelized cost of energy, and total portfolio development cost, among others that may not dependent on spatial configurations of dam locations. However, see sections below for potential changes resulting from influences of spatial configurations on energy generation and costs.
Evaluating the impacts of infrastructure footprints in portfolios
Infrastructure footprints in portfolios provide the “shadow†of hydropower development – the spatial representation of the scope of impact to features on land and in water that represent stakeholder interests.
Evaluating impacts from reservoir inundation
Inundation of social and environmental resources is often the most direct impact of reservoirs. Dams that provide storage, or are large run-of-the-river dams that increase water level behind them, can create reservoirs that inundate upstream lands that contain areas used for cattle and crop production, communities to live in and to generate income, roads and other infrastructure, cultural and spiritual areas of importance, in addition to natural ecosystems, among other attributes. The displacement of people from communities inundated by reservoirs often generates the most controversy over dam development.
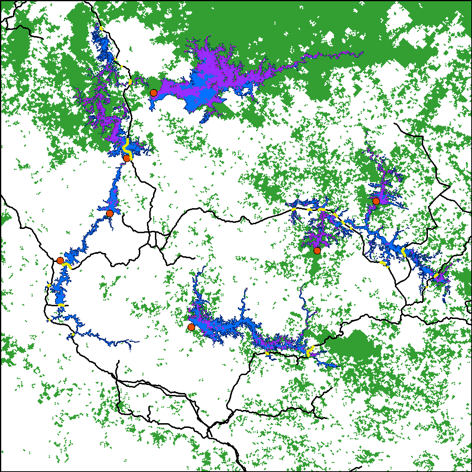
This figure illustrates the scope to which different reservoirs in a portfolio inundate environmental and social resources, here represented by forested lands (green, purple where inundated) and roads (black, yellow where inundated).  These impacts can be quantified for each reservoir (e.g. hectares of forested lands inundated, kilometers of road inundated) and summed for all reservoirs in a portfolio.
The impacts from reservoir inundation in a portfolio can be evaluated by intersecting spatial data representing features of interest to the stakeholders with the spatial locations and extent of inundated areas in the portfolio.
Examples of social impact could include the extent to which inundation affects different types of land uses, number of people, homes, villages, indigenous lands, and culturally important artifacts and places, for example. Furthermore, impact to existing transportation infrastructure can be analyzed to illustrate losses and future needs for infrastructure replacement and alternative siting, such as roads, pipelines, and bridges. From an environmental perspective, examples of impacts from reservoir inundation could include lengths and areas of freshwater and terrestrial ecosystems and the number, area or length of conservation priorities (e.g. country GAP priorities, protected areas etc.), among others.
Learn More
Further analyzing these outcomes with supplementary data can provide insights about impacts to agricultural production and economic losses, and changes in carbon sequestration and emissions, among others, resulting from development options, which may be of interest to stakeholders. Additional information may also be assessed to evaluate potential economic development, tax revenue, irrigation and agricultural production, and drinking water supply, for multi-use dams/reservoirs. The broad range of possibilities highlights the importance of stakeholder engagement to help prioritize analyses that address their interests given existing information, analytical approaches, and capacities.
Evaluating impacts from associated infrastructure
The length of additional road and transmission lines can be evaluated in portfolio analyses as a surrogate for additional costs or as a surrogate for additional terrestrial impacts. If actual costs are available, they should be included in the portfolio analyses. If costs are not available, but total development cost which includes new road and transmission lines is an interest of a stakeholder, a cost per length of road and transmission line can be used to generate an overall cost estimate for comparisons among portfolios.
Impacts to terrestrial environments from dams, roads, and transmission lines can be estimated by intersecting spatial data representing features of interest to the stakeholders with the spatial locations and extent of known and projected infrastructure footprints.
Learn More
A buffer zone for these features can be used to estimate the spatial extent of impacts. Research into expected impacts such as losses of lands used for food production, terrestrial ecosystem losses (e.g. deforestation) or changes to connectivity corridors for species, etc. should be evaluated to generate such evaluations. See Finer and Jenkins (2012) as an example for deforestation.
Simple intersections between new infrastructure development and terrestrial landscapes as described above may not be sufficient to fully understand their fragmentation impact to certain species. Further insights may be gained by in-depth inputs from ecologists and analyses using tools such as FRAGSTATS
Evaluating impacts to connectivity from dams and reservoirs
Dams directly affect longitudinal connectivity of freshwater habitats by creating a structural barrier to upstream and downstream passage and by creating dewatered areas below dams, all of which can impact fish, invertebrate, and mammal movements, as well as boat transportation. Reservoirs can create barriers to fish movements among streams that drain into them as well as to terrestrial animal movements across reservoirs.
The effects of dams and reservoirs on longitudinal connectivity in a river network can be evaluated in several ways.
One approach is to generate an overall indication of relative connectedness of a river system. Several indices representing relative overall river system connectivity include the River Connectivity Index (Grill et al 2014.), and the River Fragmentation Index (Grill et al 2015.). These indices provide insight into the overall relative fragmentation of a river system.
Another approach is to quantify the length of connected river networks that occur as a result of dam locations in a given portfolio. This approach can highlight specific types of connected networks which may be of interest to stakeholders. The Barrier Analysis Tool (see Component Three Translate stakeholder interests and objectives into metrics) is used to generate functionally connected networks - those portions of a river network within which there are no barriers. Subsequent analysis of these networks can then be conducted to quantify the length of the longest remaining river network still connected to the river mouth, longest remaining “interior†river network, and the mean length of the connected networks among others. These quantitative results can be used as surrogates of overall functional connectedness of river networks. Waterfalls that naturally affect connectivity for fish movement or boat transportation can be incorporated into analyses as part of the baseline characteristics of river network connectivity.
Along with numerical summaries, spatial representation of river networks can be provided as an output. These spatial products are particularly helpful for further analysis to evaluate the relationships between connected network characteristics and specific attributes that are of interest to stakeholders
Spatial patterns of connectivity and other spatial data such as fish migration routes, spawning habitats, and river transportation corridors can be evaluated to assess the impact of reduced connectivity on fish reproduction, boat transportation, or other social or environmental values. Teams conducting HbD analyses will need to have information about the species ecology to translate connectivity analyses to direct impacts of fisheries, and similarly for other values.
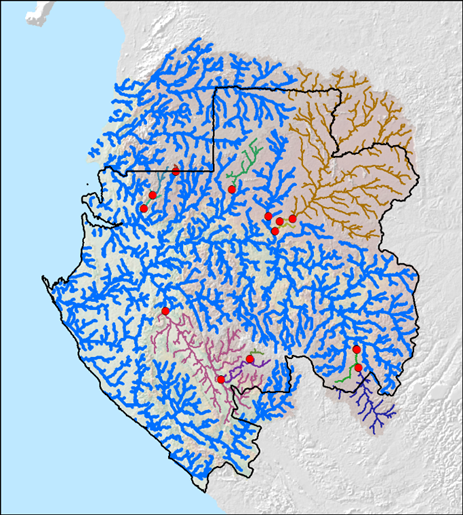
Connected riverine networks for a hypothetical portfolio of dams, Ogooué River, Gabon, Africa. The blue network is an extensive network that remains connected to the ocean. The other colored networks are interior connected networks above and/or between dams. (Courtesy of The Nature Conservancy, Gabon)
Reservoirs add an additional type of connectivity disruption not evaluated by using dam locations and waterfalls alone.
In cases where a reservoir inundates a stream network with lateral tributaries, the lentic habitat created by the reservoir can act as a ‘soft’ barrier to stream fish movements between the tributaries. This aspect of connectivity has been identified as important for fish meta-population dynamics, and should be evaluated if identified as a metric of concern by fish ecologists, fisheries biologists, or local communities dependent on artisanal or commercial fisheries that could be affected by such an impact. The Barrier Analysis Tool can be used to quantify metrics associated with this type of connectivity disruption, and spatial results can be used to assess specific species meta-population movements and effects of reservoirs on them. Additionally, movements of terrestrial species that normally occurred across streams that will be inundated may have significant impacts on population dynamics. Understanding the effects of reservoirs on these types of connectivity disruptions requires knowledge of population requirements and patterns of movement.
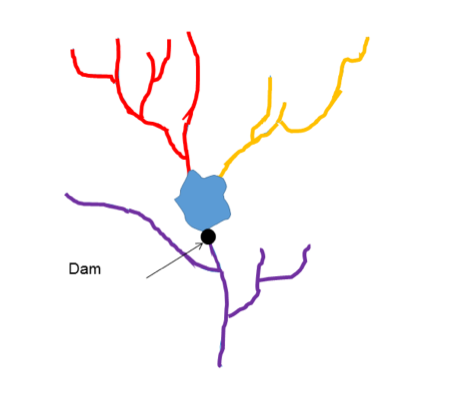
An example of connected river networks below a dam (purple), and those now isolated by a reservoir and additional upstream dams (red and yellow).
To learn more about the effects of connectivity disruption, see Greathouse et al., 2006 and Anderson et al., 2007.
Evaluating downstream alterations
Alterations to downstream flows can affect operations and electricity generation of downstream dams, or result in operational constraints imposed on upstream dams to avoid such instances. These are important considerations to take into account when considering downstream flow alterations and their potential impact on energy generation capacity and costs.
Dam impacts to downstream environmental resources from flow, sediment, and nutrient alterations are often far greater than the upstream impacts from reservoir inundation, but are generally underrepresented in analyses or ignored all together. Because human livelihoods and communities are often directly tied to functioning river ecosystems, these downstream environmental impacts can have considerable social costs.
Flow regime has been termed the “master variable†in river ecology because of its influence on multiple dynamics of riverine and floodplain ecosystems. Flow alterations downstream of dams affect a wide range of important riverine functions and features, including sediment and nutrient dynamics, habitat type, distribution and quality, seasonal connectivity and inundation of floodplains, and cues for fish migration, among others (for a summary of ecological impacts of flow alteration on, see Bunn and Arthington, 2002). These alterations affect a wide range of biota as well as human livelihoods dependent on river ecosystems, including floodplain agriculture, riparian grazing, and river transportation, among other things dependent on flow characteristics.
Assessing impact of downstream flow alteration
The impacts of downstream alterations from a portfolio can be evaluated by intersecting spatial data representing features of interest to the stakeholders with the spatial scope and degree of alteration of flow in the portfolio.
Spatial features such as migratory routes, critical habitats, priority conservation areas, floodplain agriculture, or transportation corridors can be evaluated using spatial intersections. However, understanding the types and degrees of many impacts may require additional data and knowledge of the relationships between changes in flow and certain characteristics of features, such as flood dependent agriculture productivity, fish reproduction and fisheries productivity, etc.
An additional approach to evaluating potential impacts of flow alteration to riverine, floodplain and other riparian habitats can be conducted by intersecting the segments of river that exceed a flow alteration threshold with spatial data on floodplain extent and environmental and social attributes of interest that occur on floodplains to identify the spatial extent to which they may be affected. For more information see: http://www.sima-magdalena.co (coming soon).
Evaluating impacts from altered sediment dynamics
Large reservoirs can trap nearly all sediment, except for the smallest suspended particle sizes, and even small reservoirs can trap much of the larger bedload sediment that is being transported downstream. These alterations change characteristics of downstream patterns of natural river water clarity, river geomorphology, habitat types, distribution, and quality, sediment scouring and deposition dynamics, and delta sediment nourishment. Sediments bound nutrients can represent the vast majority of nutrient transport in a given system, and disruption of sediment transport can impact nutrient dynamics of riverine systems. Changes in sediment scouring and deposition downstream can also result in alterations to lateral river migration, connectivity to floodplains, and the suspension and transport of fine sediments and nutrients which are critical to downstream habitats and productivity. Further, sediment retention in reservoirs can reduce the useful lifespan of a storage reservoir.
Admittedly, alterations to sediment dynamics are a critical aspect of river ecosystems which is often overlooked. Approaches for estimating reservoir retention in a portfolio have been applied, but are limited. Alterations to downstream river geomorphology and sediment transportation have been studied, but they have yet to be included in portfolio assessments. The current ability to model and predict the complicated and dynamic attributes of sediment are not sufficiently developed to accurately quantify the downstream scope of alterations to sediment dynamics, or the resultant impacts of such alterations, particularly at a system level. Research efforts are underway to better predict such changes at river reach levels, but the extension of scope of such models to the river system scale will require more research.
Evaluating the impacts of dam development on economic attributes
Under development—for current approaches, see The Power of Rivers: A Business Case.
Illustrating Portfolio tradeoffs
Communicating analytical results clearly and facilitating a meaningful and productive dialog around them helps to ensure that stakeholders understand the tradeoffs between competing values and provides a foundation for making an informed hydropower development decision. While there is no single method that must be used to communicate the results of an HbD analysis, the approach used should consider how to best illustrate to stakeholders the multi-metric, multi-portfolio nature that is common to all HbD analyses for any given project.
The following should be considered when developing the approaches for presenting results of a suite of portfolio analyses.
- Simplification of multiple complex metrics into intuitive visualizations
- The presentation of multiple metrics so that tradeoffs between metrics can be easily visualized
- Visualizations should be designed so that comparisons across portfolios can be easily made for all metrics
- Interactive ability of data presentation to enable stakeholders to evaluate both graphic and spatial results
- Links between summary graphics and spatial data
- Illustration of tradeoffs and potential optimized solutions among two or three metrics
- Evaluation of a few primary concerns to illustrate potential best solutions
- Ability to run real-time analyses to allow stakeholders to develop portfolios and assess them against the selected metrics
Representing multiple portfolios for evaluating tradeoffs and potential optimal solutions for two or three metrics at the same time
A few metrics may be of greatest interest to stakeholders, and evaluating two or three metrics across a suite of portfolios at one time can be supported by using two dimensional graphic plots.
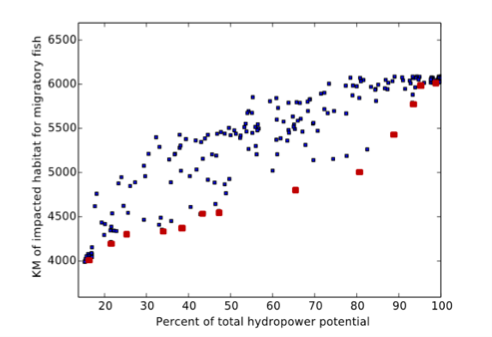
For example, the scatter plot below shows the tradeoffs of the amount of river channel affected by fragmentation and hydropower generation capacity. Highlighted in red are examples of two portfolios that have similar generation capacity but very different fragmentation results. Such examples can be useful for initially illustrating the types of differences that can be achieved through portfolio analyses. In addition, these types of illustrations can be used to define a subset of portfolios for further tradeoff evaluations. For instance, limiting evaluations of portfolios fall within a given range of energy generation may be a factor to identify a set of portfolios that will be examined further. Alternatively, portfolios that result in a range of impacts to environmental or social consequences may be excluded from further evaluations. These decisions should be made by stakeholders in a transparent manner.
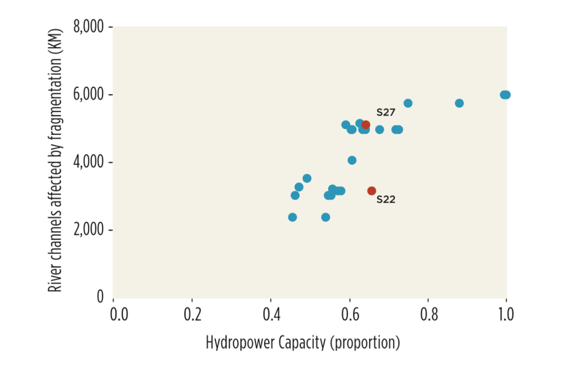
A scatter plot of river channel fragmentation and proportion of potential hydropower capacity
These individual portfolios can also be shown in maps to ground the results in a spatial context.
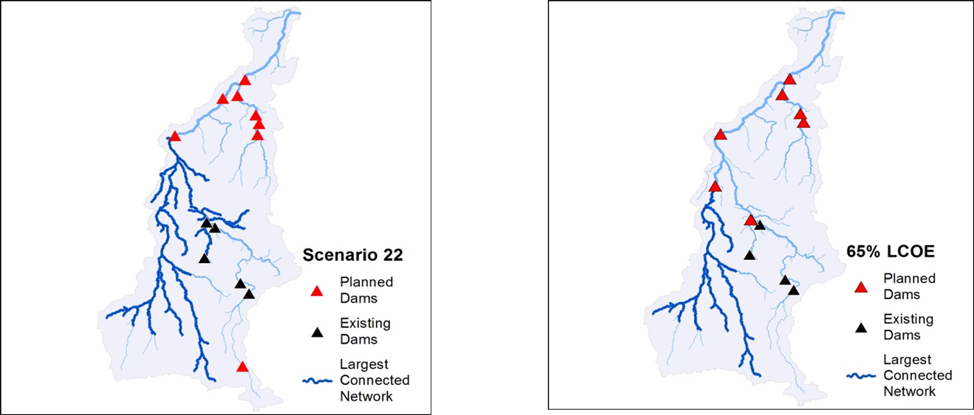
The spatial representation of the portfolios highlighted in red in the scatter plot above (Tapajos River, Brazil). (From Opperman et al 2015).
A more comprehensive example of a two-way tradeoff analysis with additional information can be illustrated, such as shown below.
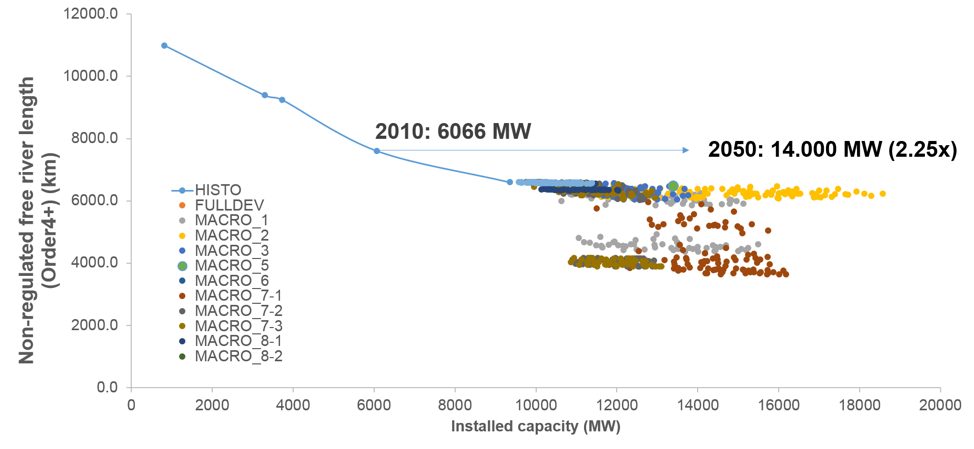
Tradeoffs of length of non-regulated river channels and energy generation capacity for a suite of portfolios. The colored dots represent different portfolio creation rules, such as concentrating dams in cascades, avoidance of high valued areas, etc. Magdalena River, Colombia. (Courtesy of The Nature Conservancy, Colombia). For more information see: http://www.sima-magdalena.co (coming soon).
Alternatively, metric results for numerous portfolios across just two metrics can be shown, as in an example below using parallel plots, where each line represents a portfolio of one or more hydropower projects and their operating rules. The plots are configured such that the desirable condition is always maximized at the top. An ideal portfolio result would be represented by a straight line across the top of the plot, representing maximum positive results for each metric corresponding to a stakeholder interest. This is an unobtainable situation, however, as it would mean the maximum amount of hydropower is achieved with no negative impacts. For an opportunity to generate examples of parallel plots with a range of dam sites, operations, and numerous metrics, using data from the Myanmar case study, see the site offered by the University of Manchester at: http://polyvis.org/sheet/pvpk4x60f
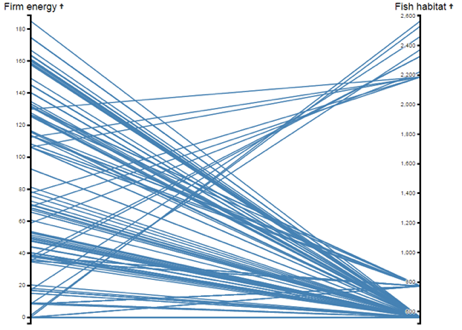
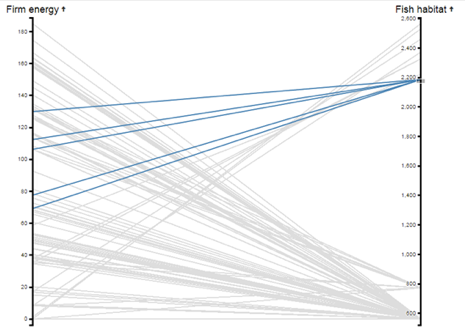
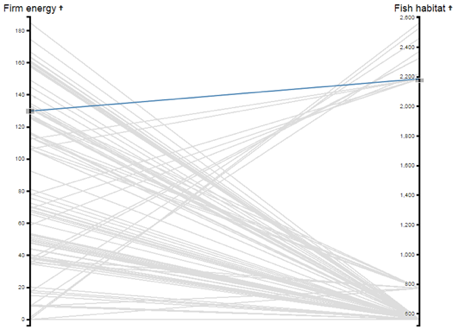
These parallel plots depict the relationship between two metrics: firm energy generation and available habitat for migratory fish. In general, increased firm generation corresponds to reduced migratory fish habitat (a). The second figure (b), however, illustrates five portfolios with relatively high firm energy and relatively high maintenance of migratory fish habitat. The third figure (c) highlights the portfolio with the best performance across both metrics. Using parallel plots, you can illustrate numerous results which, if not clearly depicted, can be overwhelming. Because this is a useful way to illustrate the breadth of portfolios evaluated, as well as highlight a set of potential portfolios with tradeoffs that might satisfy several stakeholders, and a single portfolio optimal for the two metrics, this kind of visualization of results can be very helpful in many HbD approaches.
Optimization using the Pareto Optimal Frontier
Optimization of tradeoffs for two or three metrics can be evaluated by identifying the Pareto Optimal Frontier. Pareto efficiency or Pareto optimality is where a given set of metrics (representing values of stakeholders) are optimized, meaning that one metric’s value cannot be improved without negatively affecting another metric –the area in a scatter plot that represents the optimal tradeoff for a set of given metrics. The figure below shows an example of the Pareto Frontier among a set of dam development portfolios in Myanmar and which explores the tradeoff of between energy generation and migratory fish habitat.
These parallel plots depict the relationship between two metrics: firm energy generation and available habitat for migratory fish. In general, increased firm generation corresponds to reduced migratory fish habitat (a). The second figure (b), however, illustrates five portfolios with relatively high firm energy and relatively high maintenance of migratory fish habitat. The third figure (c) highlights the portfolio with the best performance across both metrics. Using parallel plots, you can illustrate numerous results which, if not clearly depicted, can be overwhelming. Because this is a useful way to illustrate the breadth of portfolios evaluated, as well as highlight a set of potential portfolios with tradeoffs that might satisfy several stakeholders, and a single portfolio optimal for the two metrics, this kind of visualization of results can be very helpful in many HbD approaches.
Three metrics can be displayed to provide more information in a scatter plot for the evaluation of tradeoffs by adding color coding. The point “E†below represents potential optima along the Pareto Frontier for tradeoffs of total annual generation, fisheries support, and capital investment for a suite of portfolios.
Illustrating tradeoffs of more than three metrics
Once more than three metrics are represented in a tradeoff analysis, it becomes difficult to identify optimal solutions, and alternative graphic representations are generally used to illustrate the tradeoffs in metrics for a single portfolio or multiple portfolios.
Parallel plots can be further expanded to include multiple metrics. The example below shows 10 metrics for numerous portfolios of combinations of dam site and operations.
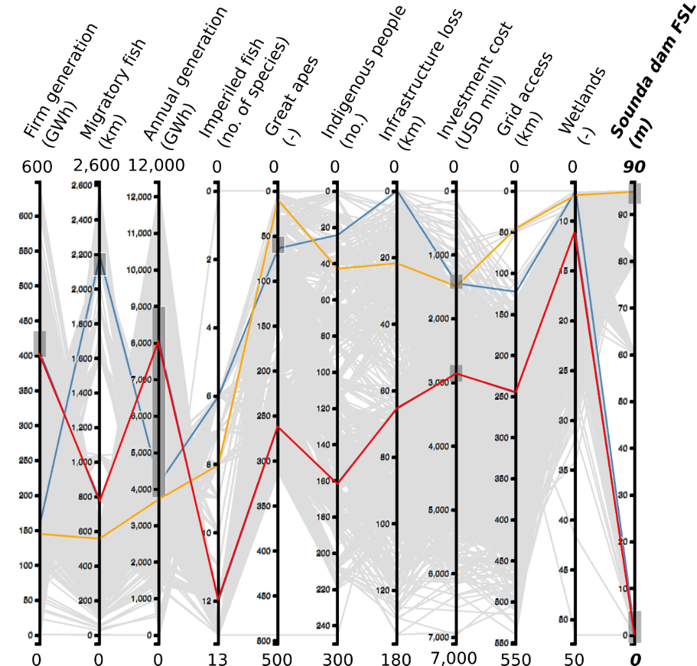
Illustrative tradeoff analysis of 10 metrics representing numerous portfolios.
An important consideration when displaying many results in the same illustration is to ensure that stakeholders are not overwhelmed with information. Figure 11 provides an example of highlighting three different portfolio results (red, blue, and yellow lines) across a background of the entire set of results for all portfolios explored. The blue and yellow lines have comparable firm energy values, but differ significantly in terms of maintaining migratory fish corridor intactness, and they are relatively similar in the performance of other metrics. The red line illustrates higher firm generation and annual generation, but is significantly and consistently lower for the other metrics with the exception of wetlands. Parallel plots can facilitate the identification of patterns which may be useful when discussing results with stakeholders.
There are numerous portfolio plots that converge on some metric values and diverge on others. These results can be interpreted to infer that some variables used in the analysis of portfolios do not affect certain metric values. This is often the case for flow management, which does not affect connectivity, but can affect energy generation and metrics associated with downstream habitats.
For more information and examples of presentation approaches see: http://www.sima-magdalena.co (coming soon); TNC’s 2015 report The Power of Rivers; TNC’s recently-released report, The Power of Rivers: A Business Case, and see Improving Hydropower Outcomes Through System-Scale Planning: An Example from Myanmar for an example of incorporating data and generation of results from an HbD process.
Capacity and Resource Requirements
It is critical to develop a team with the capacity to run the analyses and to display and the results. Such teams would be most efficient and effective if they contained the following capacity:
- Manager who can maintain progress on tasks, communicate with team members, partners, and upper management of organizations/agencies
- Freshwater and terrestrial ecologists, social scientist/anthropologist, hydrologist, hydropower/infrastructure expert/engineer, and economist to help guide analyses and interpret results
- Spatial analyst and quantitative modeler to conduct analyses
- Experts in graphic displays
Potential areas for development or improvement
This component currently represents the most up-to-date list of best practices for assessing development options and illustrating tradeoff results, however, several areas for development or improvement still exist.
- Refined approaches to estimates of changes to energy production as a result of changes to flows
- Refined approaches to estimates of changes in project costs associated with collective dam locations and operations
- Refined approaches to estimating cumulative impacts of dam development on sediment and nutrient dynamics and temperature alterations
- Refined approaches to estimates of impact from flow alteration to riverine biodiversity, flood dependent agriculture and other human uses of the river and floodplain
- Incorporating climate change into portfolio assessments for considerations of future risks
In Conclusion
Portfolio analysis of collective impacts and benefits that result from dam locations and operations can be generated using a range of approaches and tools. Regardless of the approaches or tools used, there is a wide range of attributes that can be assessed. The range of attributes assessed should be limited to those related to the metrics stakeholders have expressed interest in. The number of portfolios generated will depend on the number and combinations of potential new dams and alternatives associated with them. The audience of stakeholders may determine a limited range of potential portfolios. Limits may be set by such things as boundaries to the range of energy production - e.g. between 50-75% of energy production potential, or total energy generated for a given geography. Additionally, a range based on what is considered to be realistic possibilities for potential dam development projects may limit the set of portfolios as well. Evaluating every possible combination of existing and future dams and alternatives associate with them can generate a number of portfolios and outputs that can be overwhelming. Some of these problems can be addressed through different approaches of visualizing results.
Alternative approaches to illustrating tradeoffs between competing stakeholder values highlights the complex nature of costs and benefits of hydropower development. No one portfolio is generally the best in every regard. Rather, stakeholders must make values-based judgements that are most appropriate given the context of their geography, energy needs, and their interests. Tradeoff visualization methods can highlight portfolios which perform relatively well across a range of metrics, as well as those that have significant conflicts among stakeholder interests. However, they are not intended to provide the identification of a single portfolio for dam development - this falls within the domain of the stakeholders and decision makers.
Understanding how to assess hydropower development portfolios and illustrate tradeoff results is the basis for a successful HbD effort. These processes and products provide the information for stakeholders and decision makers to evaluate and have dialogues about which development options result in tradeoffs that are most acceptable to society, and will guide the future development of hydropower for them. Now that you have an understanding of why you would do this, and techncial methods that you can use, proceed to Component 5 - Transfer to learn about transferring the results to better inform decisions.
Acknowledgements
The development of the Hydropower by Design approach was conceived through constructive dialogue and a range of collaborative projects supported by our partners. Learn more.