The Chesapeake Bay Lowlands (CBY) ecoregion is centered on the Chesapeake Bay and includes most of Delaware, all of the coastal plain in Maryland and the District of Columbia, and coastal Virginia south to the James River. The ecoregion ends at the Atlantic Ocean on the east and the Piedmont to the west, where Interstate 95 follows the Fall Line through much of Maryland and Virginia, closely approximating the western boundary of the ecoregion.
The landscape of the ecoregion east of the Bay – the Delmarva Peninsula - is dominated by agriculture and characterized by low, flat sandy plains cut by wide, slow-flowing rivers bordered by extensive swamp forests and tidal marshes. To the west of the Bay, a broad plain with generally low slopes and gentle drainage divides is dissected by a series of major rivers – the Patuxent, the Potomac, the Rappahannock, the York and the James – that form a series of large, parallel peninsulas running into the Bay. The western shore in Maryland (especially the northern portion) is dominated by urban/suburban development around and between Washington, D.C., Baltimore and Annapolis. The western shore in Virginia is a lightly-developed, heavily forested area impacted by urban/suburban development near Richmond and Newport News-Hampton.
The CBY ecoregion also includes 140 miles of Atlantic coastline along the Delmarva Peninsula characterized by a complex and dynamic patchwork of barrier islands, salt marshes, tidal flats and large coastal bays, with significant development impacts at Ocean City, Maryland and several beach towns in Delaware. Subdivided by the Conservancy from the much larger Outer Coastal Plain Mixed Forest Province mapped by Bailey, CBY grades into the North Atlantic Coast ecoregion on the south shore of the Delaware Bay, and with the Mid-Atlantic Coastal Plain below the mouth of Chesapeake Bay.
These maps will download as high quality pdfs.
Landforms,
pdf
Managed area ownership,
pdf
Element occurrences: natural communities,
pdf
Element occurrences: species,
pdf
Block size,
pdf
Candidate matrix forest blocks,
pdf
Candidate matrix forest blocks by ELU group,
pdf
Full portfolio,
pdfAquatic systems condition summary,
pdf Aquatics: selected streams and matrix blocks,
pdf
Condition Analysis,
pdf
Estuarine, coastal, and marine significant conservation areas (SCAs),
pdfHistoric population growth,
pdf
Population growth predictions,
pdf
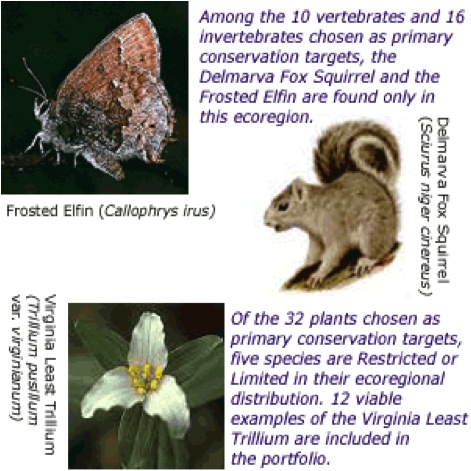 Species:
 Methods used to assess plant and animal conservation targets - target selection, goal setting, and viability assessment (pdf). Animals and plants selected for the portfolio are in the
species results section (pdf).
Tabular data: The three species target tables that follow are in the original report's appendix and will open in excel: Species occurrences summaries for:
Delaware,
Maryland,
Virginia.
Species EOs by subsection (
xls) is an extract from
occurrences.xls that includes all species targets and their distribution across subsection. A reference map of CBY subsections is shown above the maps section (
here).
Terrestrial Ecosystems and Communities: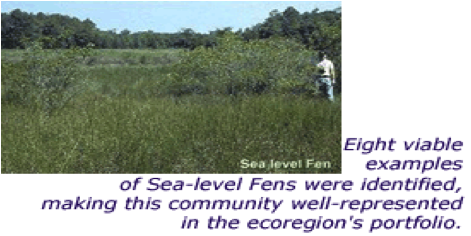
Methods used to assess community conservation targets -
target selection, goal setting, and viability assessment are in this pdf. Communities selected for the portfolio are in the plan report's
Terrestrial Ecosystems and Communities Results section (pdf). The latest national vegetation classification (NVC) for CBY is documented in Internal classification of ecological communities: Terrestrial vegetation of the United States, Chesapeake Bay Lowlands Ecoregion, published July 2003,
available as a pdf. In addition, a key to the vegetation types is included as a
separate pdf.
Tabular data: The terrestrial ecosystems and communities target table (
link) is in the original report's appendix and will open in excel. The tables that follow were assembled to support more detail and flexible examination of target data, in particular for communities, as they are distributed across subsections of the ecoregion. See the reference map for CBY subsections, above the maps section (
here).
CBY Communities with Goals (
xls) compares the expert estimated numbers of associations and subsection distribution of ecosystems with the total number and number of viable examples per subsection included in the Heritage databases.
Community EOs by Subsection (
xls) is an extract from
occurrences.xls that includes all community targets and their distribution across subsections.
Matrix Forests:
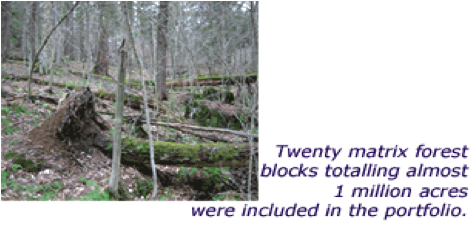 Methods used to develop and assess matrix-forming ecosystem conservation targets (pdf). Matrix forest examples selected for the
 portfolio are in the plan report's Matrix-Forming Ecosystem Results section (
pdf). Ecological Land Units (ELUs) are introducted in the methods chapter, but without much technical description. Read more about ELUs in the supplementary metadata (.
doc).
Tabular data: The following matrix forest target table has been added to the original report. It describes ELU composition for each matrix block: Chesapeake Bay Matrix Block Assignment (1/21/01). EOs by Matrix (
xls) is a sample extract from
occurrences.xls that
shows the distribution of all viable species and terrestrial community targets that occur within a portfolio matrix block. Block reports are pdf documents that summarize all important descriptive and quantitative information about a matrix block. They were created for the 20 matrix blocks that were chosen in the final portfolio, and can be found
here.
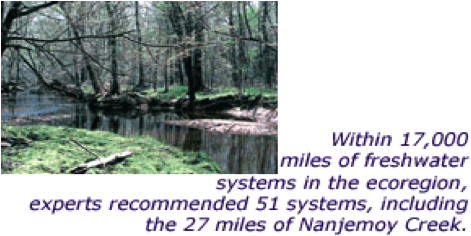
Aquatic Systems:
 Methods
 used to assess aquatic conservation targets - target selection, goal setting, and viability assessment (pdf).
Aquatic systems selected for the portfolio, in the plan report's
Aquatic Results section (pdf).
Tabular Data: The four CBY Ecological Drainage Units (EDUs) are
Eastern Delmarva, Western Delmarva, Northern MDVA Shore, and Southern MDVA Shore. For these EDUs, the
following table has summary data and is ready to print.
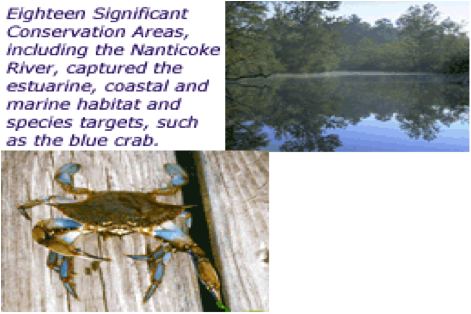
Estuarine, Coastal, and Marine Systems:
 Methods
 used to assess estuarine, coastal, and marine conservation targets - target selection, goal setting, and viability assessment (pdf). The same section continues with Results of estuarine, coastal, and marine systems selected for the portfolio (pdf). A separate Bibliography is included for marine targets (
pdf).
Descriptions of Habitat and Species Targets (
pdf). All tables are included in above documents. There are no separate Excel files for marine targets.
| Dataset name |
Definition |
|
Vector Data |
| aquashed_rank |
Small watersheds with condition ranking attributes |
| blocks |
Road, utility line, railroad, and major hydrography line and polygon features used to build ecosystem blocks; chosen for impact on biodiversity. |
| cby_subsec |
Ecoregion subsection boundaries. |
| cbyaquasysmacro |
EPA 1:100000 RF3 river reaches for USGS Drainage Region 1, with TNC macrohabitat and system attributes |
| cbyhuc |
8-Digit Hydrologic Units for the Coterminous U.S. with TNC EDU attributes. |
| cbyrf3icmtx |
EPA 1:100000 RF3 river reaches for watershed intersecting Chesapeake Bay, with matrix, expert nomination, and portfolio stream attributes. |
| census |
Housing unit density for the U.S. census block groups in 1960-1990 and estimates for 2000-2040. |
| cerclis |
Point sources of pollution: EPA Superfund data used in aquatic condition analysis. |
| cities |
Major cities (over 10,000) in CBY. |
| counties |
Line and polygon boundaries for counties in Northeastern U.S. |
| dam |
National inventory of dams, used in aquatic condition analysis. |
| dws |
Drinking water supplies, used in aquatic condition analysis. |
| ecmdata |
Estuarine, coastal, and marine datasets |
| ecoregions |
Ecoregion boundaries for the Eastern U.S. Source TNC ECS, based on USFS (Keys et al.) subsections and Natural Heritage Program. |
| gnis |
Place names: an automated inventory of physical and cultural geographic features in the U.S. |
| ifd |
Point sources of pollution: Industrial Facilities Discharge used in aquatic condition analysis. |
| matrix |
Viable matrix forest examples in the Chesapeake Bay Lowlands ecoregion. |
| mgd_areas_draft |
DRAFT version of managed areas: All managed lands with a conservation purpose, along with other large state or federally managed lands greater than 500 acres. |
| mjrds |
Major roads: U.S. interstate and state highways and other major thoroughfares. |
| pcs |
Point sources of pollution: Permit Compliance System used in aquatic condition analysis. |
| rdstmcross |
Road stream crossing points. |
| rf3_sys1rank |
EPA 1:100000 RF3 reaches within the TNC Chesapeake Bay Ecoregional Stream System Type 1 group. |
| rf3_sys5rank |
EPA 1:100000 RF3 reaches within the TNC Chesapeake Bay Ecoregional Stream System Type 5 group. |
| rf3_sys6rank |
EPA 1:100000 RF3 reaches within the TNC Chesapeake Bay Ecoregional Stream System Type 6 group. |
| rf3_sys7rank |
EPA 1:100000 RF3 reaches within the TNC Chesapeake Bay Ecoregional Stream System Type 7 group |
| rf3_sys8rank |
EPA 1:100000 RF3 reaches within the TNC Chesapeake Bay Ecoregional Stream System Type 8 group |
| rf3_sys9rank |
EPA 1:100000 RF3 reaches within the TNC Chesapeake Bay Ecoregional Stream System Type 9 group |
| rf3_sys10rank |
EPA 1:100000 RF3 reaches within the TNC Chesapeake Bay Ecoregional Stream System Type 10 group |
| shedpoly |
Local watersheds for each RF3 reach in the sequenced flow network for Chesapeake Bay Ecoregion. |
sig_cons_areas
|
Coastal, estuarine, and marine Significant Conservation Areas in CBY. |
| states |
State boundaries. |
| triw95 |
Point sources of pollution: Toxic Release Inventory; Water release in 1995 used in aquatic condition analysis. |
|
Raster Data |
| dem30_cby |
30 meter Digital Elevation Model: National Elevation Dataset processed to fill cell depressions or 'sinks' that reflect isolated surface error. |
| elu30 |
Ecological Land Units: Grid of 30 meter cells that combine the Quaternary geology of the Chesapeake Bay Lowlands and the region's landforms. |
| cby_nlcd |
National Land Cover Dataset of the USGS and EPA for the CBY ecoregion. |